2024 – the year GB electricity demand turned a corner

Something quite fundamentally shifted in the electricity sector last year. You’ll be forgiven for missing it, it happened quietly and without fanfare.
For the first time in 19 years (excluding the 2009 financial crisis, extreme cold spells in 2018, or post-Covid recovery in 2021), GB electricity demand went up rather than down. Yes, that’s right, electricity demand in GB has been falling since 2005. Until last year.
As anyone who’s looked at demand will know, there’s no single source of demand data. The different metrics include interconnector flows, parasitic demand, losses, and pure meter point consumption. Yet several sources agree that demand went up year-on-year, by anywhere from 0.3% (the Low Carbon Contract Company’s eligible demand dataset) to 1.5% (NESO’s Transmission System Demand dataset).
It’s worth noting that not all data sources necessarily agree. Demand eligible for the Feed-in Tariff scheme (complete up to the end of September) suggests a significant reduction in demand occurred year-on-year in Q2 2024, driving the overall figure down. But with the majority of sources suggesting an increase, let’s explore why this might have happened and what it means.
Why has GB electricity demand been falling?
A few factors have been driving a decrease in energy demand over the past two decades. The enhanced energy efficiency of homes, appliances and lighting has supported a substantial fall in domestic electricity consumption, which dropped from 126TWh in 2005 to 93TWh in 2023.

Source: DESNZ DUKES electricity supply, availability and consumption
Improved efficiency is also supporting reduced use in the industrial sector – as has a general decline in GB industry and associated intensive electricity use. Industrial consumption fell from 117TWh in 2005 to 86TWh in 2023. Sectors including iron and steel use felt the most severe impact, declining from 675GWh in 2005 to 176GWh in 2023. Coal and coke use also fell, from 1,066GWh in 2005 to 104GWh in 2023.
A further factor, which cannot be separated from the above two, is price response. The average price of electricity (including the Climate Change Levy) purchased by non-domestic customers in the UK has risen from 5.15p/kWh in 2005 to 27.20p/kWh in 2023. Over the same period, DESNZ’s domestic electricity price indices rose from 64.5 in 2005 to 287.6 in 2023, suggesting at least a four-fold rise in electricity costs.
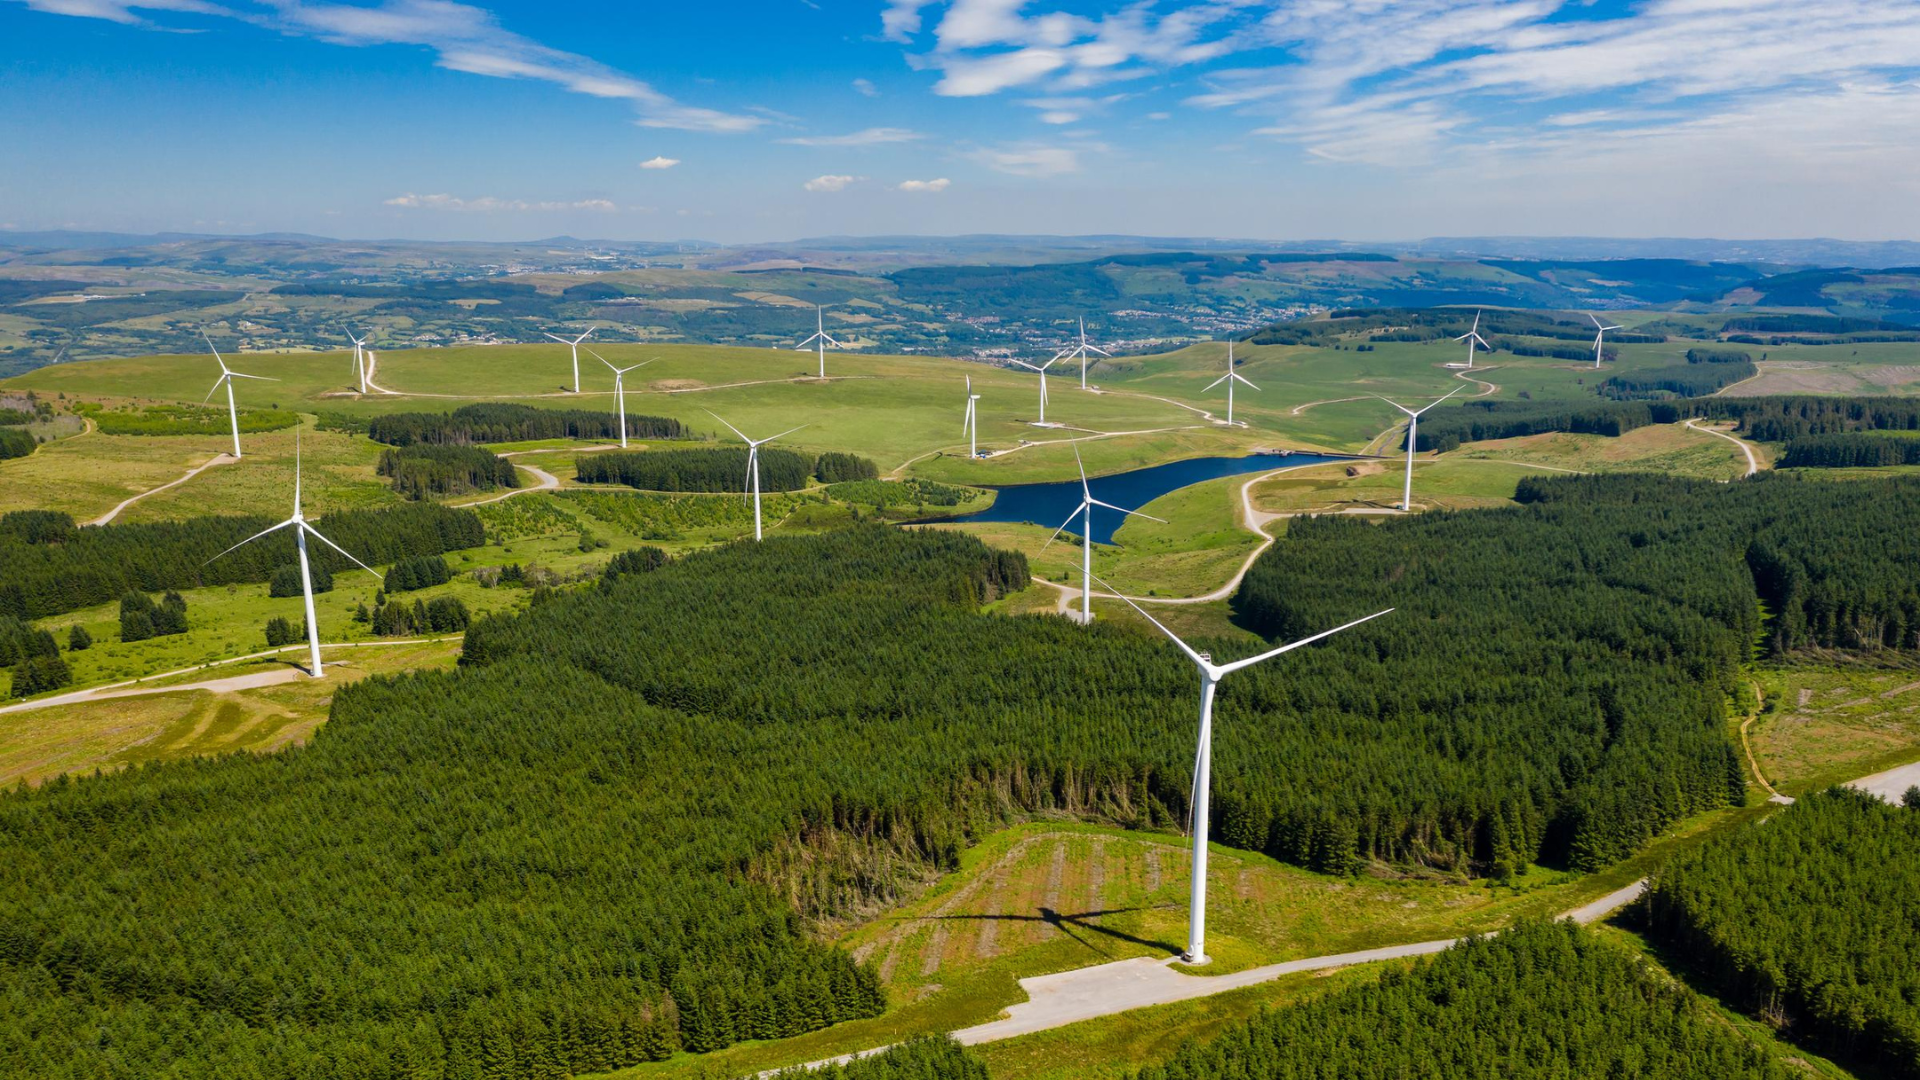
Another factor is the installation of behind the meter (BtM) power generation facilities. This has been influenced by increasing electricity costs and the growing need for – and public acknowledgement of – the importance of decarbonisation. Many homes and businesses now have solar panels on their roof, and larger businesses can use a range of BtM technologies. These include combined heat and power (CHP), wind turbines or other generators.
These assets reduce the power their host sites draw from the grid, and therefore contribute to lower GB-wide demand. This was particularly prevalent during 2022 and 2023, following the price spikes driven by the Russian invasion of Ukraine. Particularly pronounced over this period is the increased uptake of larger arrays of panels, which are likely to have appeared on business roofs.

Source: DESNZ Solar Photovoltaics deployment in the UK
What’s changed?
In recent years, the rate of the annual decrease in electricity demand has been slowing down.
The electrification of heat and transport has contributed a steady rise to electricity demand statistics. There were 60k certified heat pump installations in 2024 and, while the number is fairly modest, the government is targeting 600,000 installations per year by 2028. Government data on the Boiler Upgrade Scheme (BUS) suggests over 90% of heat pump installations replace a fuel other than electricity, thereby transferring more of the nation’s heating demand onto the electricity system.

Source: DESNZ Boiler Upgrade Scheme Statistics November 2024
The deployment of electric vehicles (EVs) has also had a significant impact on electricity demand. Battery EVs have climbed to 19.6% of new car registrations in the latest available data for 2024, according to the SMMT, and have grown 21.4% year-on-year. Other types of EV – including plug in and hybrid – are also seeing significant increases in market share.
Perhaps in part due to the introduction of a range of cost exemptions and rebates for Energy Intensive Industries (EIIs), EII demand increased 21% last year from 8.3TWh to 10.0TWh. This certainly contributed to the overall increase in demand. So too, no doubt, did the relatively new phenomenon of climbing data centre demand, with the announcement and progression of several new data centres punctuating the year.

Source: LCCC Actual Eligible Demand Dataset
We also witnessed a slight reduction in small scale solar installations last year. The recent peak of sub-10kW solar installations (typically those small enough to be roof-mounted BtM) was 64.67MW in June 2023, according to DESNZ statistics. This had fallen to 50.40MW installed in September 2024.
It’s important to note that the increase in demand doesn’t appear to be due to anomalous weather conditions. For example, the Met Office announced on 2 January that 2024 was provisionally the fourth warmest year on record, despite having a relatively mild summer and the UK experiencing its equal-warmest year on record for average minimum temperature. Therefore, neither heating or cooling demand should have been unusually high.
What does this mean?
You may be wondering why this is a big deal. Here are a few examples from different perspectives:
Cost: The majority of the Third Party Costs are fixed, set, or established and recovered over the prevailing demand. The last two decades of shrinking demand has increased the cost per unit of electricity. With rising demand, this influence will reverse, putting some pressure on costs and offsetting some increases.
Investment: Billions of pounds of investment is required in the electricity system to hit the government’s goals of ‘Clean Power 2030’ (CP2030) and ‘Net Zero by 2050’. A growing system demonstrates demand for the product is increasing and lowers the cost per unit as noted above.
Decarbonisation: In many ways, historic falling demand has supported us in decarbonising as it means we’ve needed fewer units of low carbon energy to meet our demand needs. Now that demand’s increasing again, investment in renewable generation assets needs to keep pace to deliver CP2030 and our long-term goals.
Infrastructure and operations: The impact on peak demand caused by the electrification of heat and transport is important. This is because it affects both infrastructure requirements and system balancing/operations and associated costs. While higher energy usage would tend to imply greater peak demand, it’s important in the future electricity system that demand is as flexible as possible. Not only to mitigate high peak period costs, but to take advantage of periods of high intermittent power generation.
Now the corner may have been turned on demand for one calendar year, it will be interesting to see whether it’s an ongoing trend. Certainly, National Grid Electricity System Operator (NGESO), before it rebranded to NESO, predicted that demand would increase more rapidly in its ‘Future Energy Scenarios’. This increase in demand is predicted to rise year on year, reaching 20TWh per year in one scenario in the 2030s.

Source: NESO FES 2024
At Drax Energy Solutions, we’ll continue to track market movements and trends, and provide you with a summary of the key drivers of the electricity bill, Follow us on LinkedIn to keep up to date with our latest articles.
Follow us on LinkedIn