Negative power prices, and why they’re happening more often, explained

Alongside many other energy markets across Europe, the GB power market has experienced a growing number of negative electricity prices in recent years. This trend coincides with the rise of intermittent renewables, particularly wind and solar generation, in the energy mix. The increased reliance upon such assets has been supported by subsidy schemes such as the Renewables Obligation (RO), Feed-in Tariff (FiT) and, most recently, Contracts for Difference (CfD).

The revenue support for renewable assets under the CfD scheme helps them achieve a ‘strike price’ that’s compared to a market reference price. For intermittent generators, this is the day-ahead price and is known as the Intermittent Market Reference Price (IMRP).
If the strike price is higher than the IMRP, the subsidy covers the difference paid to the generator. If the strike price is lower than the IMRP, the generators pay back the revenues. Although this mechanism typically provides financial stability, the rules change for most intermittent generators when the reference price falls below zero. If the IMRP falls below zero, there are no payments for assets awarded a contract in Allocation Round (AR) 4 or higher. This leaves even subsidised generators exposed during negative pricing periods, recognising that negative prices are indicative of a surplus of generation.
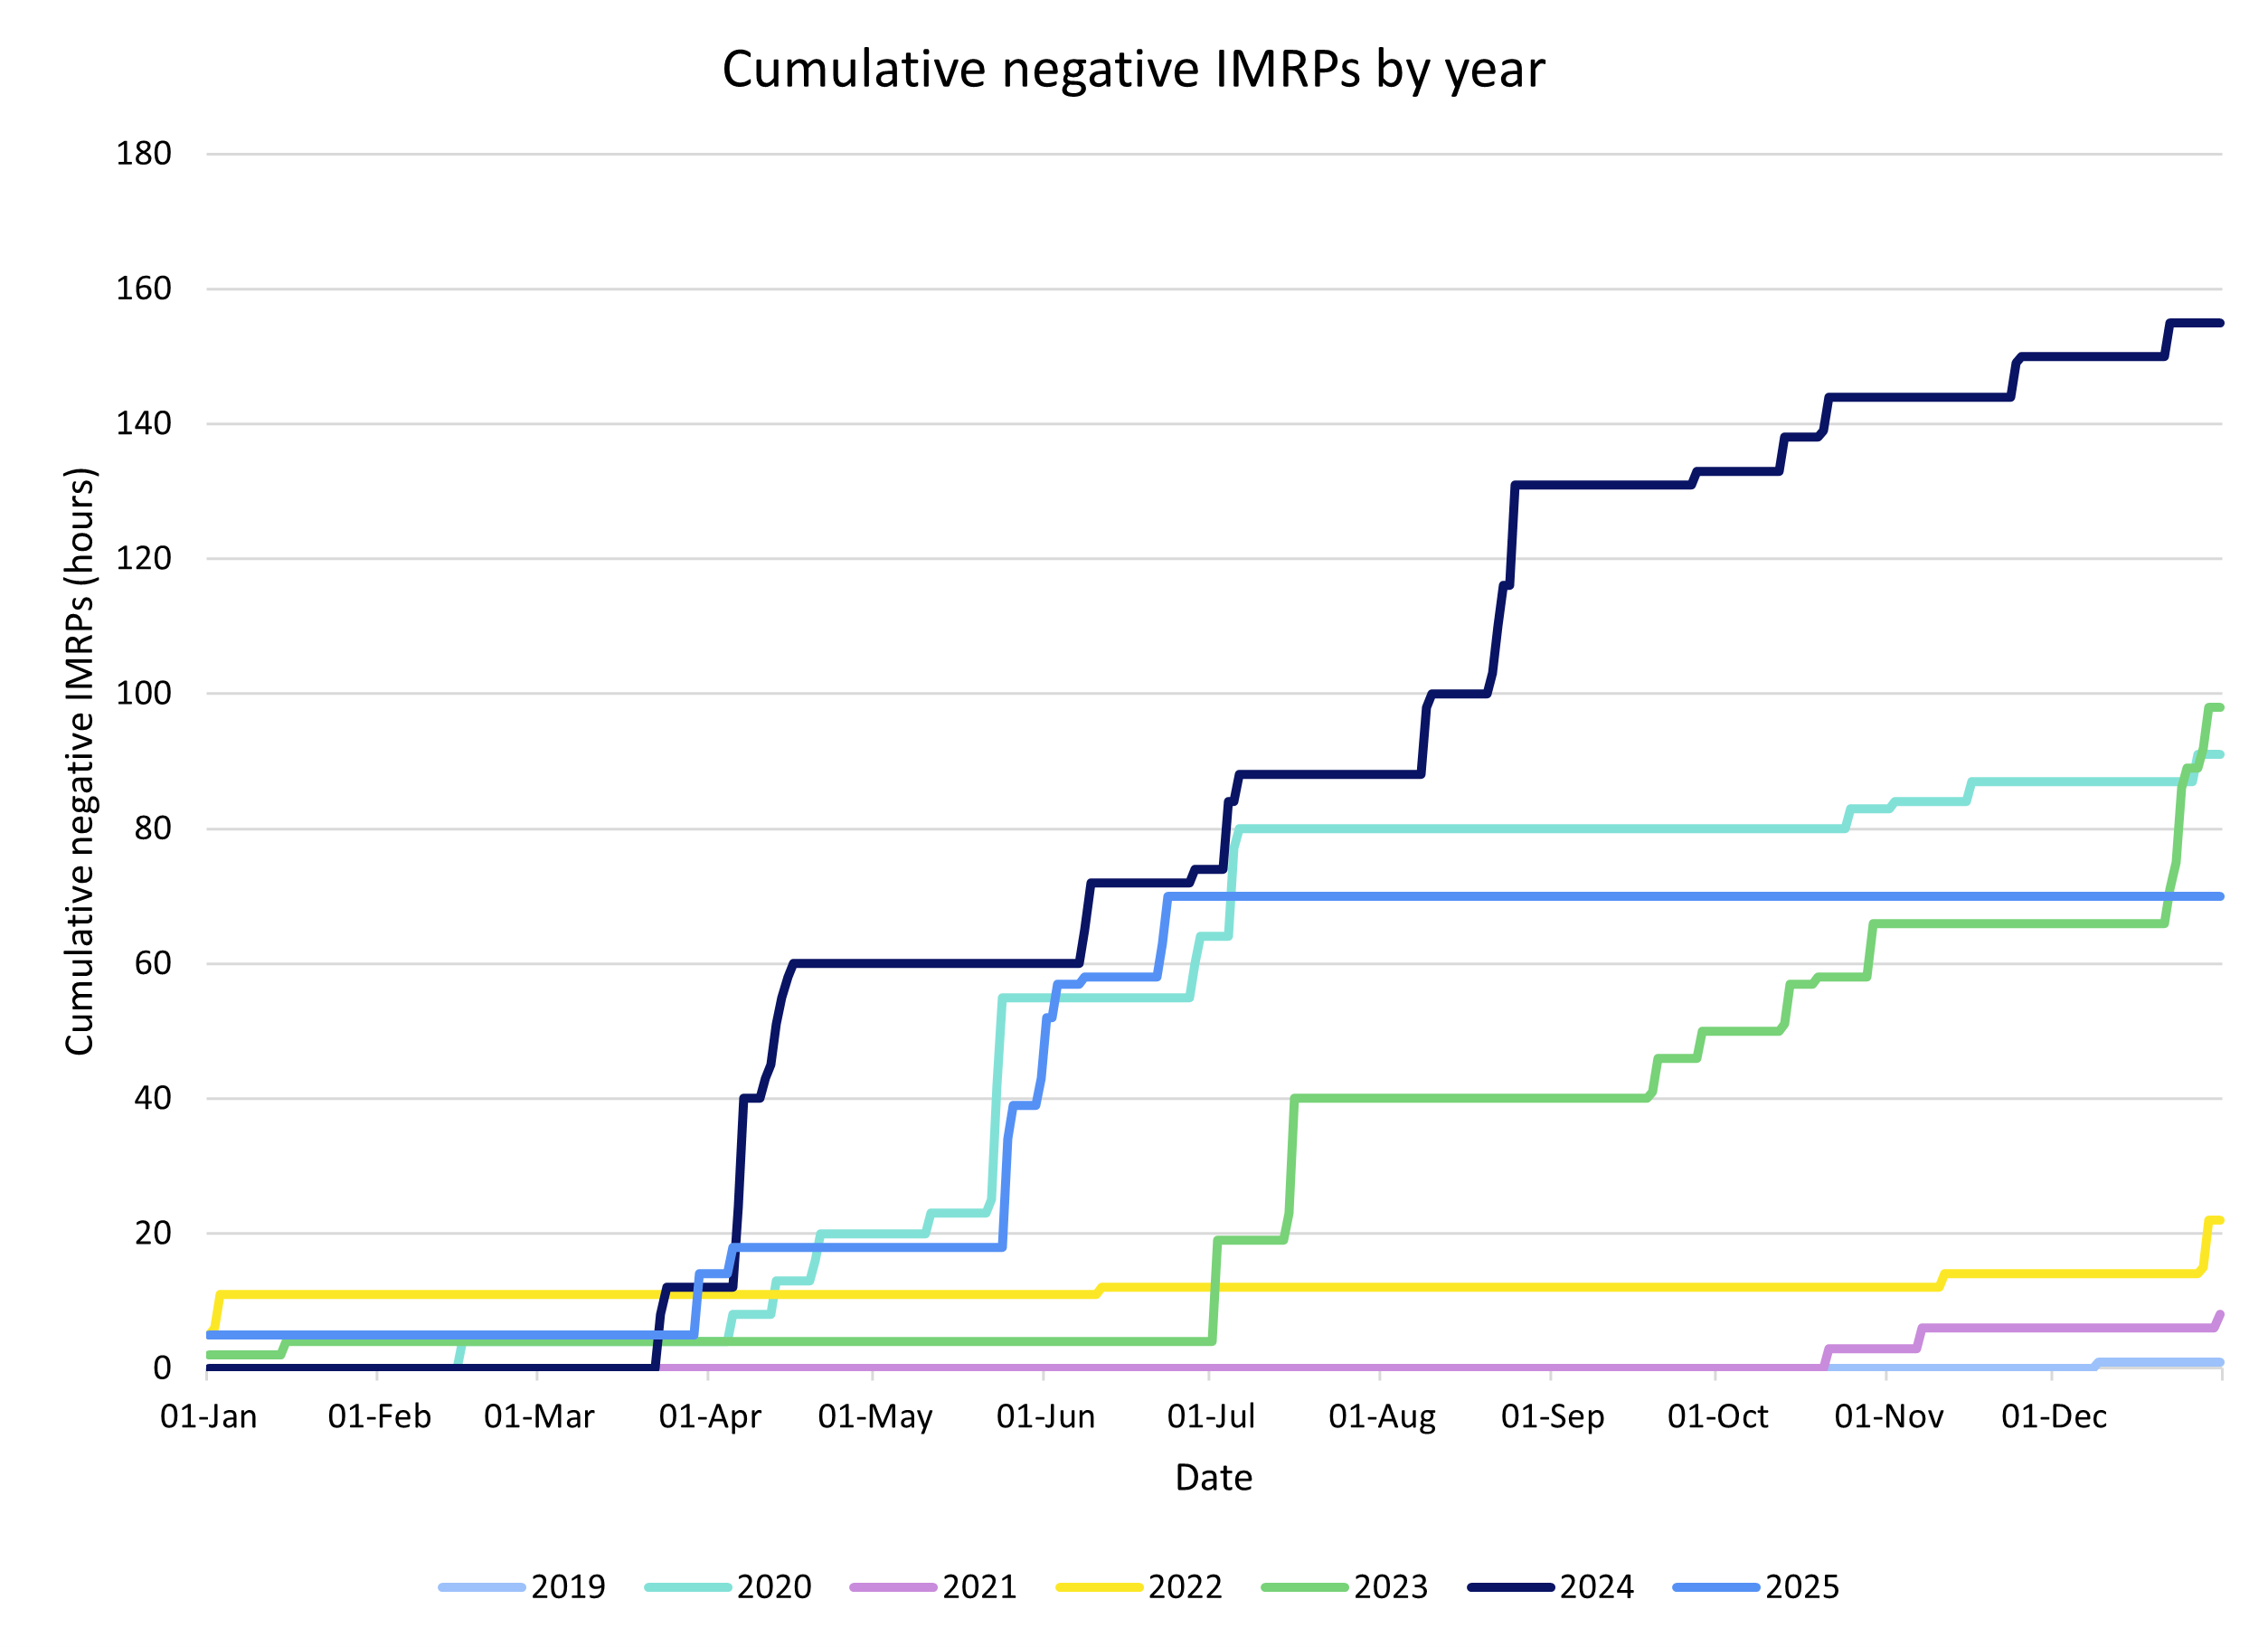
The following graph summarises the cumulative number of negative IMRPs since 2016, by year and date. The 2025 data is complete to 24 June.
We can derive a few trends from the graph:
- The number of negative pricing periods is generally increasing over time, with 2024 having the highest number to date at 155 hours. 2020 saw a significant uplift due to low demand during the Covid 19 pandemic.
- A significant number of negatively priced periods occur from the end of March – as winter demand falls away and sunshine hours improve. We also see such periods in the summer and autumn.
- 2025 presently has fewer negatively priced periods than 2024 and aligns more closely with 2020. This is likely because spring 2025 was very still compared to historic norms, despite also being very sunny. Recent blustery weather has contributed to an upsurge in negative prices.
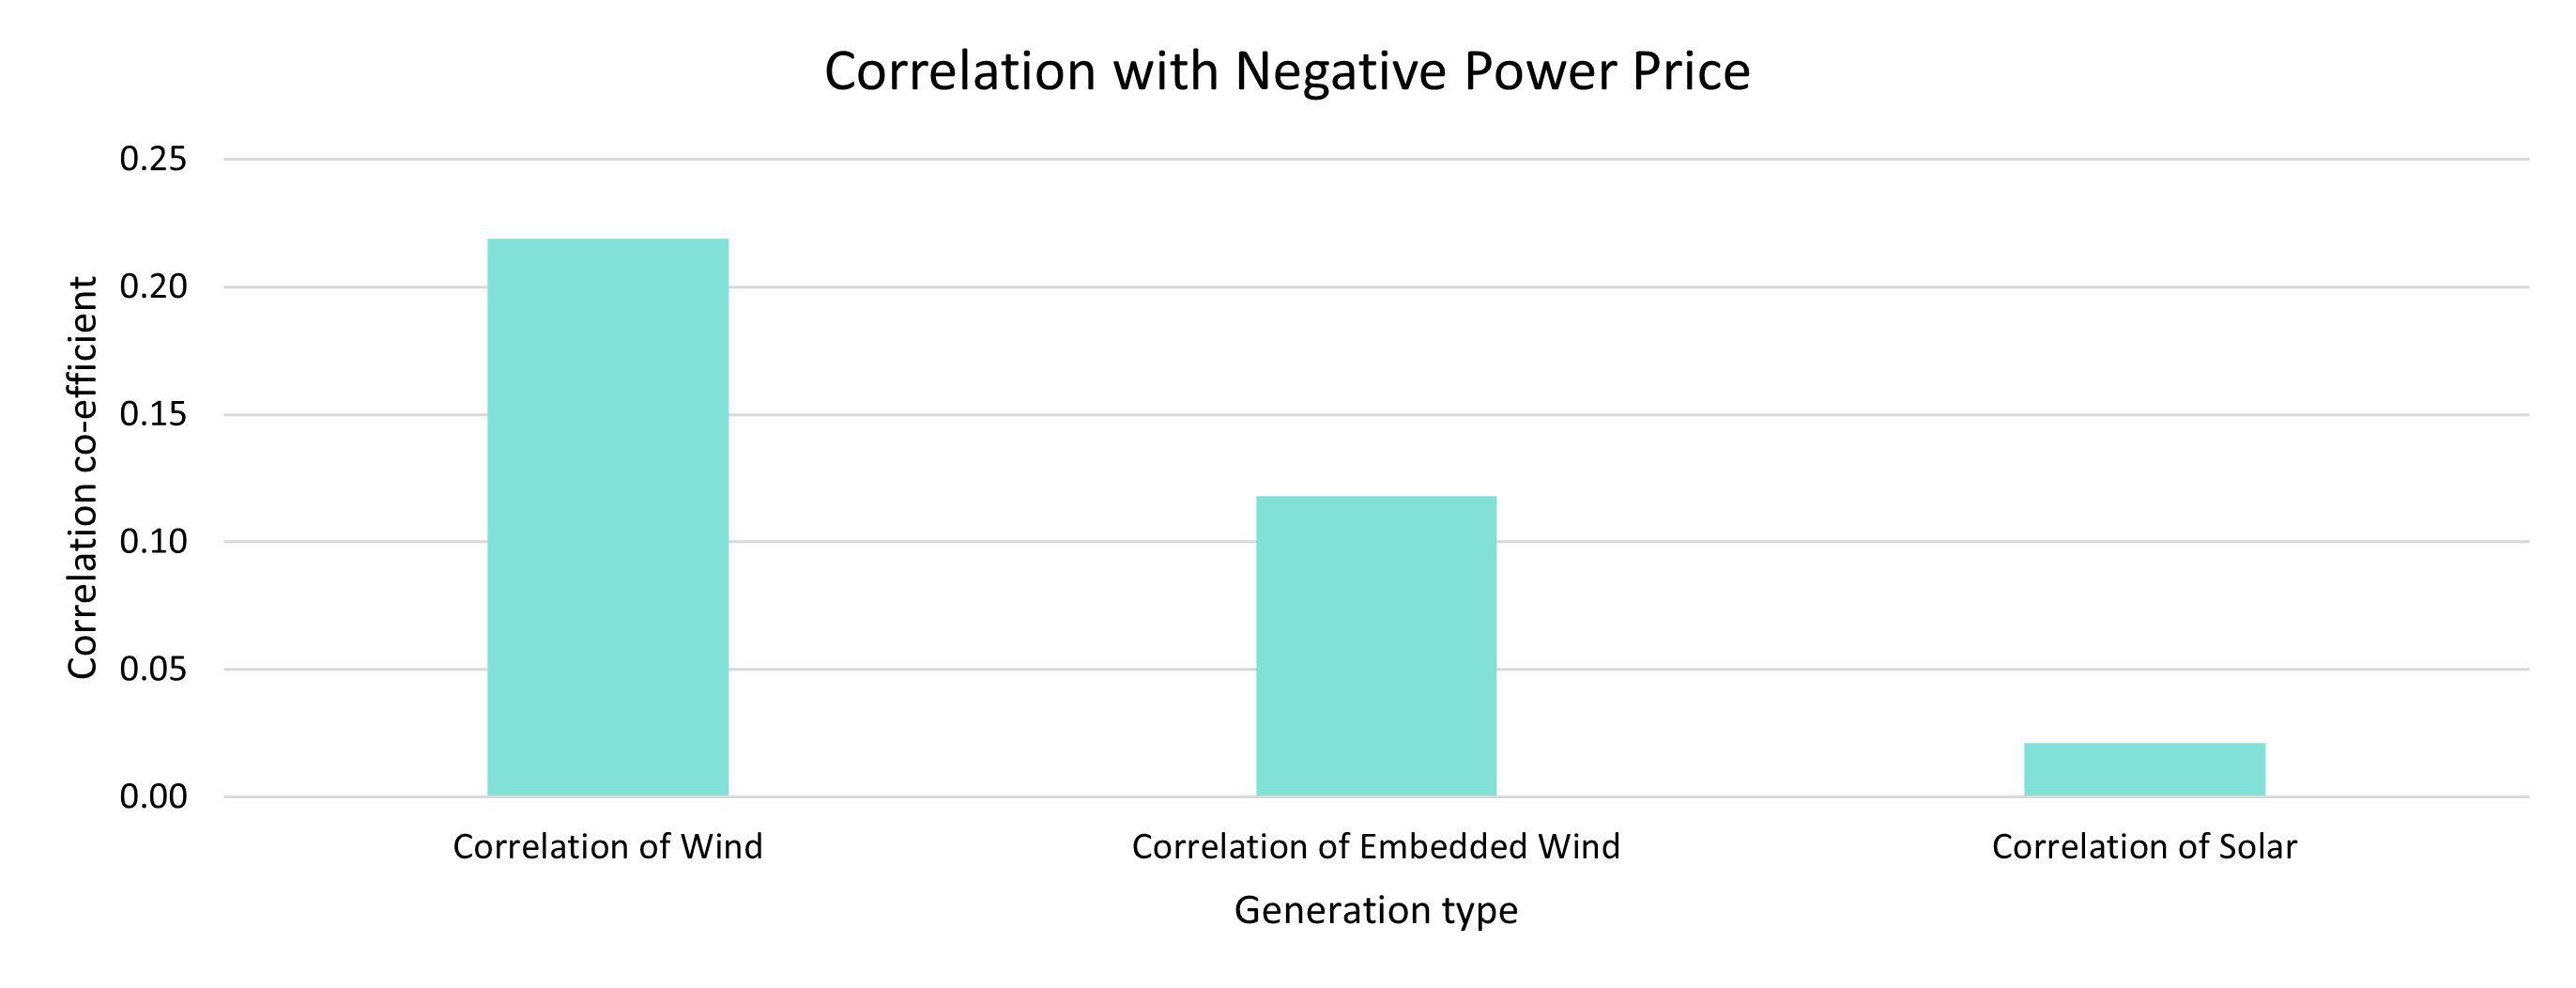
The historical data backs up these conclusions by showing that negative pricing tends to correlate more strongly with wind output than with solar output – see Figure 2, below. This is likely due to periods of high wind generation during the night or early morning, when demand is lowest. In contrast, solar generation aligns with daytime energy consumption and can exert less negative pressure on prices unless combined with either wind output or very low demand.
Weekends also play a significant role, with consistently lower demand from reduced industrial activity. Of the circa 728 weekend days across the seven-year period from 2019 to 2025, 40 recorded at least one instance of negative pricing — a frequency of around 5.5%.
Meanwhile, 5 out of 60 bank holiday dates over the same period saw negative prices, equivalent to 8.3%.
While weekends contribute more negative pricing events in absolute terms due to their frequency, bank holidays are more likely to have negative pricing events. This is probably due to lower demand than even at weekends, and their prevalence over spring and summer periods with good solar resource and comparatively lower seasonal demand.
What next?
Looking forward, the 2024 NESO Future Energy Scenarios have interesting projections about offshore wind capacity. The prediction is for significant expansion across all net-zero pathways, with capacity potentially reaching 100 GW by 2046. As renewable penetration deepens, the importance of accurate forecasting, flexible generation and demand, and responsive system design will grow.
Capturing and responding to short-term fluctuations in wind output will be critical to both forecasting and system operation. Simultaneously, customers that can respond flexibly to periods of high renewable output are likely to experience lower energy costs than their counterparts. Flexible storage technologies like batteries and pumped storage hydro will be increasingly important to help manage peaks and troughs in output.
At the same time, policy design is evolving. Government is reviewing the structure of the CfD as part of its Review of the Electricity Market Arrangements (REMA) workstream. This aims to incentivise optimal operation of assets on the grid while supporting low-cost growth in investment in GB.
Ultimately, the rise in negative power prices reflects both the success and the growing pains of the energy transition. While intermittent renewables bring clean, low-cost power, they also introduce new volatility. Ensuring the GB power market remains resilient will require not only better forecasting and flexibility — but also the deployment of more flexible technologies in a responsive policy environment.
Subscribe to our newsletter
Sign up to our monthly newsletters and get the best of Drax Insights sent directly to your inbox.
Disclaimer
We’ve used all reasonable efforts to ensure that the content in this article is accurate, current, and complete at the date of publication. However, we make no express or implied representations or warranties regarding its accuracy, currency or completeness. We cannot accept any responsibility (to the extent permitted by law) for any loss arising directly or indirectly from the use of any content in this article, or any action taken in relying upon it.


