TNUoS tariffs forecast to grow significantly in 2026-27

On 30 April, National Energy System Operator (NESO) published its first Transmission Network Use of System (TNUoS) draft tariffs for the charging year commencing April 2026. The charges show significant increases against the final tariffs for the current (2025-26) charging year, published in January 2025.

Comparison to 2025-26 TNUoS tariffs
A representative Low Voltage Site Specific Residual Band 2 (LVSS RB2) customer sees an average increase of 38% in their total annual TNUoS charge, compared to the 2025-26 final tariff. This varies between regions (shown below) with London seeing the smallest growth (35%) and the South West experiencing the largest (40%).

The main driver for the forecast rise in TNUoS is a £1.01bn increase, since 2025-26, in the revenue to be collected through demand. This is due to an increase in allowed revenues for the Onshore Transmission Owners (ONTOs), Offshore Transmission Owners (OFTOs) and Interconnector contributions, as well as other items. However, as the price control process still hasn’t set the allowed revenues for 2026-27, they’re based on assumptions. For example, NGET – the largest of the TOs – has based its revenue forecast on an inflated version of 2025-26 revenues. This means there’s potential for forecasts and actual revenues to be substantially different. The final determinations, where revenues are set, are expected in Winter 2025.
Residual charges – levied as a fixed charge on bills – will recover £997mn (98.7%) of this £1.01bn increase in revenue. This means our LVSS RB2 customer will see a 38% increase in residual cost compared to the previous year. The forecast for other user types anticipates a rise in residual costs of between 5% and 49%.
Locational tariffs also increased, on average by 16% for our LVSS RB2 customer, due to changes in nodal demand and generation forecasts. NESO expects to see an additional £14m of locational revenue collected in 2026-27, while forecasts for gross half-hourly (HH) chargeable demand have decreased by 0.28GW since 2025-26. This means there’s less demand to spread the additional costs across. Locational cost movements vary substantially across regions, as shown below.
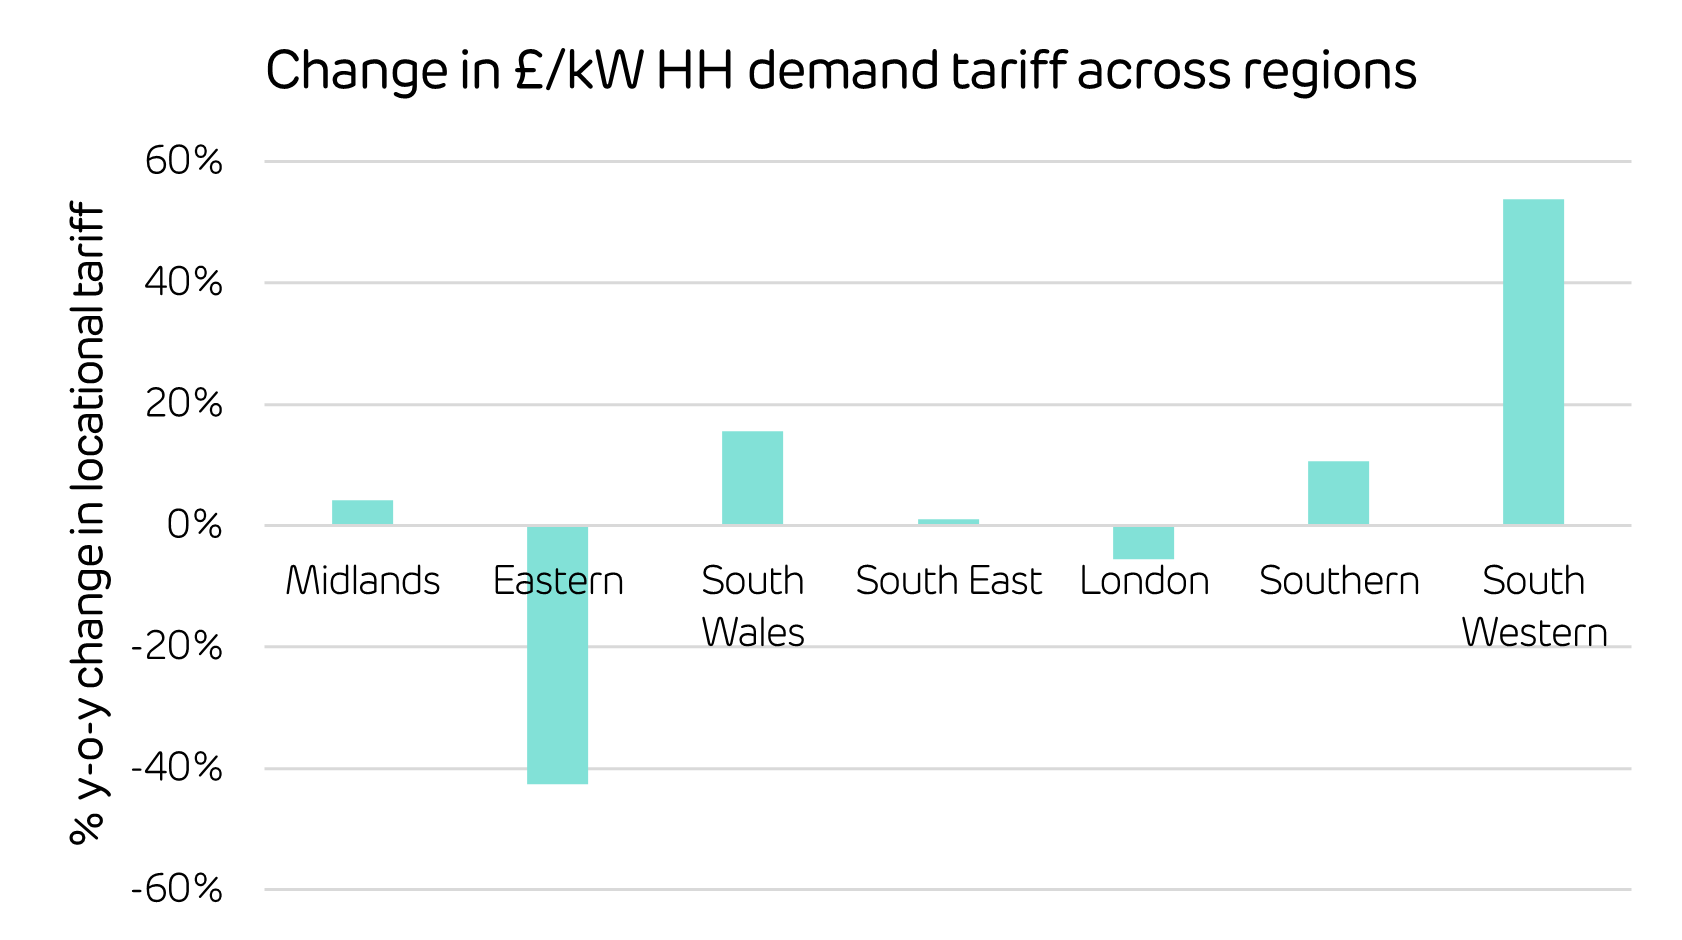
The South Western region is anticipated to see the largest growth (54%) in its £/kW HH demand tariff, due to decreases in contracted Transmission Entry Capacity (TEC). This means there’ll be less generation flowing power onto the transmission system in the region, meaning it will need to flow in from further away. In contrast, the Eastern region has the largest predicted decrease of 43%.
While the charging methodology hasn’t changed since the 2025-26 final tariffs, there are several ongoing proposals that may impact TNUoS tariffs in the future. Please also note that all components of the forecast are, at present, based on forecast data; the actual data will start to feed into the draft tariffs in November.
Comparison to the ‘Five-Year View’
NESO’s Five-Year View of TNUoS, published in April 2024, predicted an increase in costs between 2025-26 and 2026-27 – although the rise was forecast to be much lower.
On average, for the representative customer, the total cost from the April 2025 draft is 25% higher than the 2024 forecast. The driver for this, predominantly, is the higher residual fixed per day charges.

However, locational tariffs experienced much more deviation from the forecast in 2024. The most significant changes to the HH £/kW demand tariff, since the Five-Year View, include:
- The Midlands increased by 214%
- South Wales grew 298%
- Eastern fell 73%
The locational component is difficult to forecast since it’s subject to changes in assets connected to, and flows on, the transmission system. However, it makes up a much smaller part of the overall TNUoS cost compared to the residual charge, and so these variances have a relatively smaller impact.
Next steps
NESO will publish its next TNUoS forecast, the Five-Year View of 2026-27 – 2030-31 TNUoS tariffs, in August 2025 – and we’ll provide an update, if necessary.
Disclaimer
We’ve used all reasonable efforts to ensure that the content in this article is accurate, current, and complete at the date of publication. However, we make no express or implied representations or warranties regarding its accuracy, currency or completeness. We cannot accept any responsibility (to the extent permitted by law) for any loss arising directly or indirectly from the use of any content in this article, or any action taken in relying upon it.