2025 transmission charges to rise, but by less than previously forecast
On 31 January, National Energy System Operator (NESO) published its final Transmission Network Use of System (TNUoS) charges for the charging year commencing April 2025.

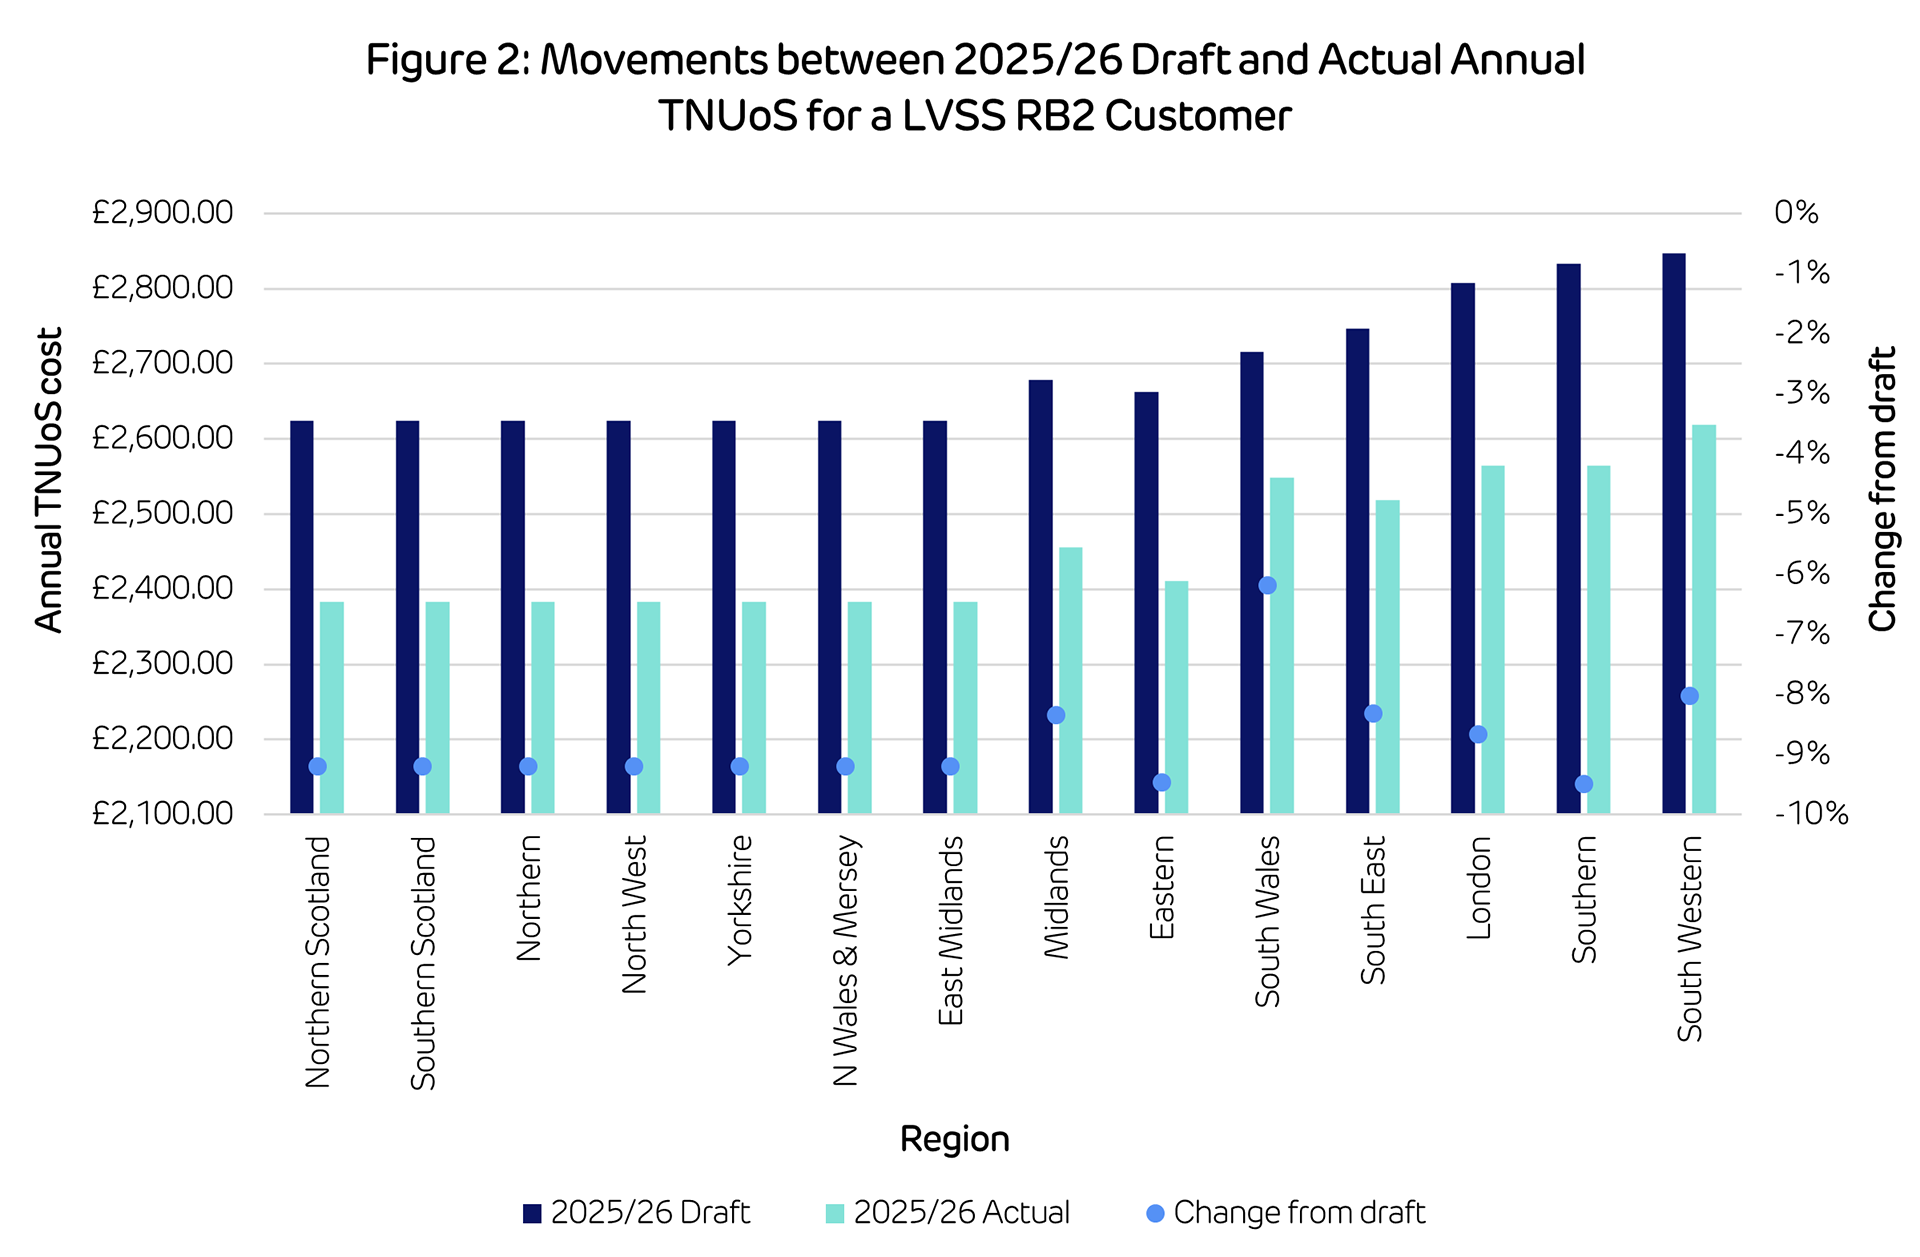
The tariffs show marked increases against the tariffs for 2024/25, but are around 9% lower than the draft tariffs, published November 2024. Headlines for our typical Low Voltage Site Specific Residual Band 2 (LVSS RB2)* customer include:
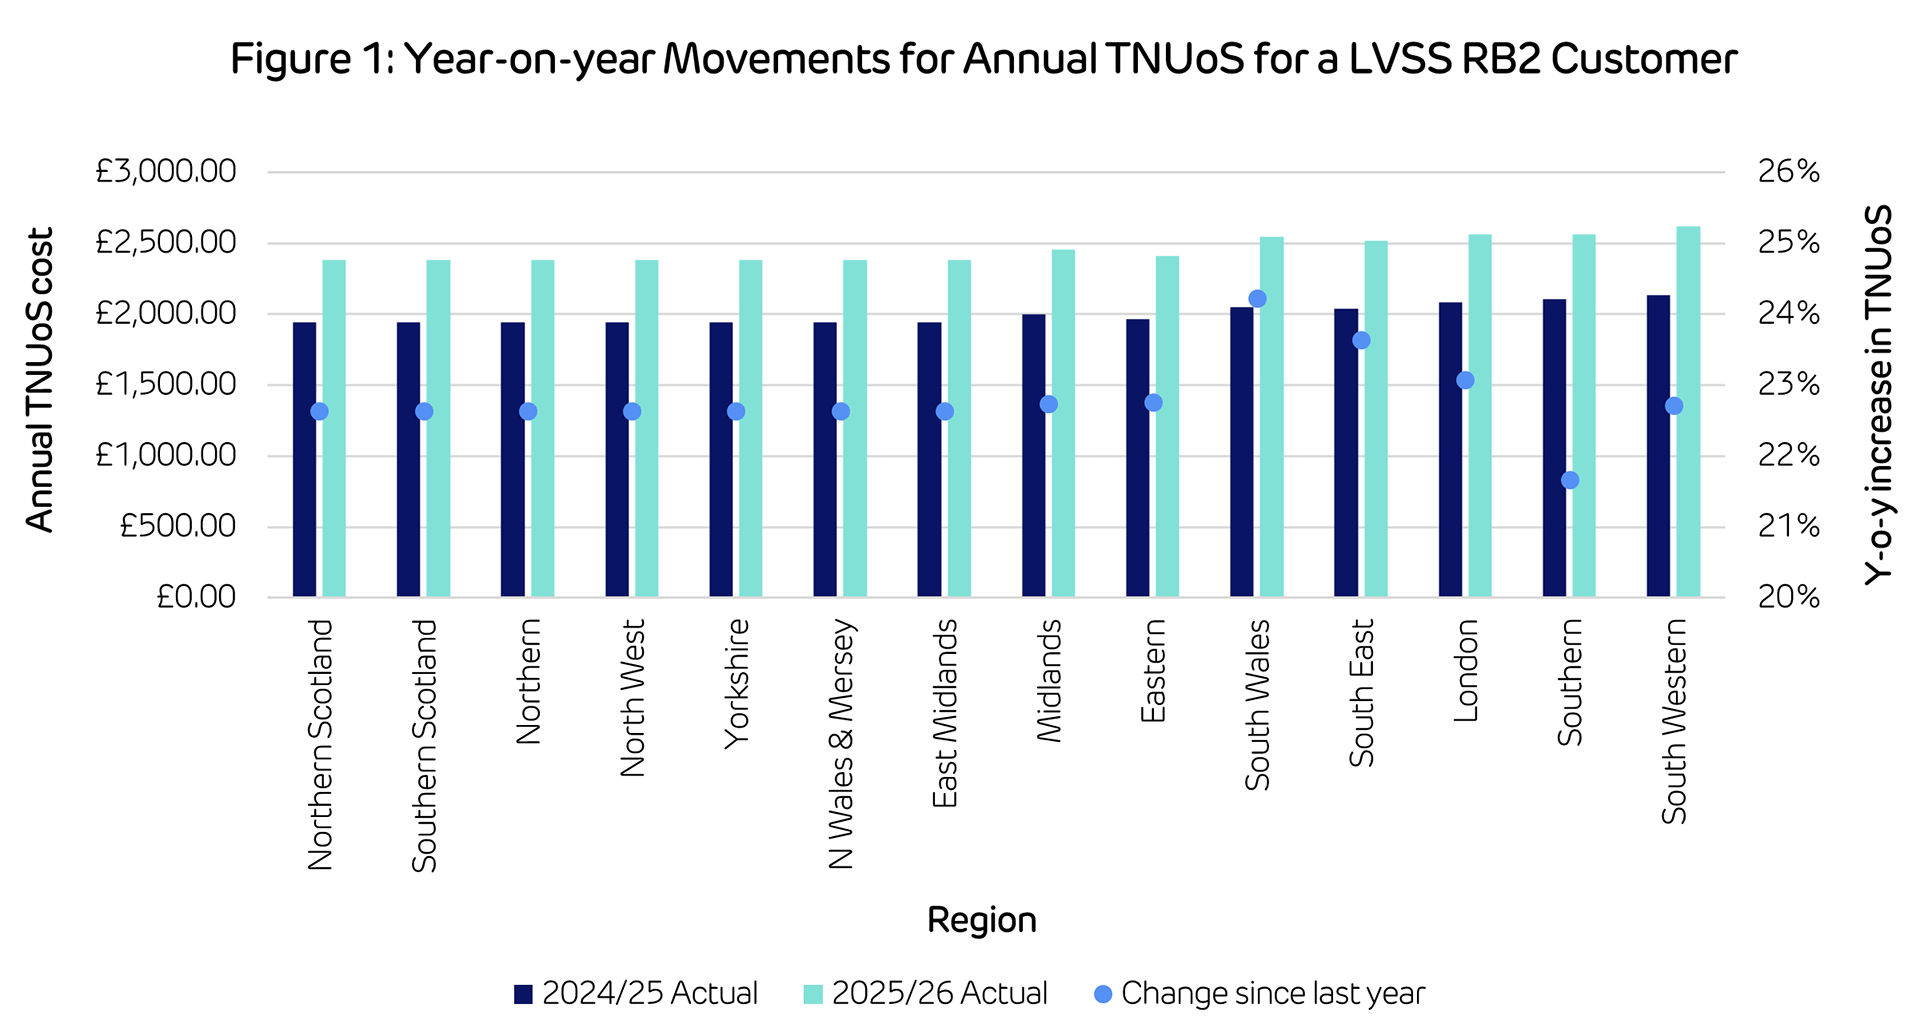
- Total costs will increase an average of 23%, with a variance of +/- 1% across all regions (see Figure 1)
- Charges will be around 9% lower than the draft tariff published in November
- The largest regional movements in triad charges for half-hourly settled customers will be in South Wales (+£2.38/kW, +53%), South West (+£1.92/kW, +23%) and South East (+£1.71/kW, +44%)
- However the impact of these charges will depend on usage over the three triad periods, as those with lower triad usage will see less impact. Generally these charges comprise a much smaller proportion of the bill than the fixed standing charge.

Different user types will experience a wide range of increases to their TNUoS fixed charges, however. Low Voltage connected customers with no Maximum Import Capacity in Residual Band 1 (LV_NoMIC_1) will see over a 100% increase in tariffs while some user types will see increases as low as 11% or 15% (Extra High Voltage RB2, and LVSS RB4 respectively). Therefore, it’s important to assess the impact on a site-by-site basis.
*Our “typical” LVSS RB2 customer has a 20% load factor over the triad period and has an MIC of 110kVA. Analysis has been conducted using 2024/25 line loss factors, as 2025/26 data is incomplete for all regions.
Drivers for movement in fixed charges compared to the November draft tariff
NESO reports an average 9% decrease in Transmission Demand Residual tariffs since the November draft forecast. Since the draft, they have updated the site count forecasts for a few bands where the Distribution Network Operator (DNO) has provided new information. However, the consumption data used to allocate the proportion of residual revenue to each charging band remains unchanged and uses DNO actual data for October 2023 to September 2024.
The decrease between the draft and final tariff is largely due to revisions to Onshore Transmission Owner (ONTO) Allowed Revenue, submitted in January 2025. NGET and SHET see a combined decrease of £331.11m, while SPT increased £14.27m, resulting in a net reduction of £316.84m. Revisions to Offshore Transmission Owner (OFTO) revenue inflation and forecast OFTO Asset Transfer Dates and Interconnector contributions have an aggregated growth of £5.34m, while other pass-through items have decreased by £104.89m, contributing to the overall decrease since the November draft.
Triad and unit rate drivers compared to November
NESO reports both the average gross half-hourly (HH) and non-half hourly (NHH) demand tariffs for 2025/26 increased since the draft forecast. HH tariffs rose £0.68/kW to £8.49/kW, and NHH increased 0.005p/kWh to 0.38p/kWh.
The increase is driven by increases in demand zone 10 (South Wales) with the finalisation of the Nodal demand forecasts. However, there is much fluctuation within regional tariffs through zones 8 to 14. The most impacted areas are South Wales and the South with the former increasing £3.07/kW from the draft while the latter sees a £1.16/kW decrease.
For a low-voltage site specific residual band 2 (LVSS RB2) customer, the average HH demand tariff across locations sees an 8% increase from the November draft, while the residual cost decreases by an average of 9% across locations. This results in a total average cost decrease of 9% from the draft. Figure 1 breaks down the change in total annual cost by region.

Comparison to 2024/25 TNUoS tariffs
With respect to year-on-year changes, the total TNUoS revenue to be collected has increased £898.47m since the 2024/25 tariffs were set. This is the main driver for the upward increase in TNUoS fixed tariffs on a year-on-year basis.
Changes to the regional HH demand tariff are driven by finalisation of the nodal demand forecast and a general reduction in the level of gross half-hourly chargeable demand. This was forecast at 16.94GW for the final tariff, compared to 17.95GW in the draft tariff.


